For all parts in IFS Connect it's possible to configure debug/trace to files.
This will be very important when trying to find the reason for problems like the
examples below:
Note: When debug is activated the performance will be
slower. Do not have it activated
during normal operation. For normal operation there is a
Connect Monitoring concept
to use that contains log-files and configurable alarms.
Note: IFS Application is using new, common, logging framework. The most of IFS Connect code has been rewritten to use the new concepts in conjunction to the old one, but there are still places only using the old, IFS Connect own, debugging concept.
It is recommend to read about the IFS Connect overview before you start to use the debug concept.
If an Application Server tasks fails, the reason for the error will be shown
in the Schedule Application Server Tasks window.

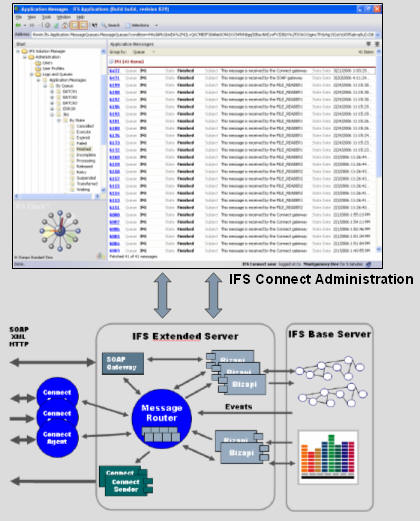
If message located on a queue has failed or is in retry mode the error will be shown like below:

If Outbound asynchronous Bizapi's for some reason are not being sent, the first
thing to check is
the status of the Connectivity outbox message.
Outbound asynchronous Bizapi's use Connectivity outbox as a temporary
storage on the way out.

The picture below shows a case where the message is successfully executed in
the Application Server but is moved to
the ERROR queue in IFS Connect. For example when a routing rule is missed.
Look at the ApplicationMessage to see the actual error text.

Large part of IFS Connect code is using the new IFS logging framework for logging and debugging. The amount of logged information is controlled by the level of category 'integration' (for the core IFS Connect parts) and 'gateway' (for SOAP Gateway). But some parts of IFS Connect framework are still using the old fashion, IFS Connect own, logging framework, so in some cases it can be necessary to work with both concepts.
The installation process creates logging configuration files in the directory <ifs_home>\instance\<instance_name>\conf.
By default there are three configuration files there:
| File name | Description |
|---|---|
| j2ee-logging.properties | Logging configuration of the Application Server |
| batchserver1-logging.properties | Logging configuration of the default Batch Server (batchserver1) |
| connectserver1-logging.properties | logging configuration of the default Connect Server (connectserver1) |
All three configuration files are referred from respective start script. When creating a new instances of Connect or Batch server you have to create new start script by copying and modifying the existing one – don’t forget to copy and modify the corresponding configuration file for logging and reflect the new file name in the start script!
By default all three files create their log files in subdirectories
j2ee, batchserver and connectserver respectively of the
logging top directory
<ifs_home>\instance\<instance_name>\logs.
Each configuration creates a log file with name ifsalert.log that is
supposed to collect all the error messages. There will be also an IFS Connect log
file with name ifsconnectlog.log (for Application Server) or ifsconnect.log
(for stand-alone servers). Logging level for this log file is set to 'info'
(read more about logging levels
here).
In the configuration files there are some commented sections that can be used as templates when enabling debugging for IFS Connect. In case of Batch and Connect servers the sections are very similar and look as follow:
handler.<handler name>.type=textfile
handler.<handler name>.filename=<path to the debug file>
handler.<handler name>.filter=ifs.fnd.log.TagFilter,<name of the object to debug>
handler.<handler name>.includepackage=false
IFS Connect is using the tag concept for marking debug messages with queue and
connector names. So simply use the queue name (for Batch Server) or connector name
(for Connect Server) as <name of the object to debug> to filter
messages related to the actual queue or connector. Of course, the logging level
has to be set to debug or at least trace. Either globally or for the
‘integration’ category, if you want to exclude some statements from the framework.
A tip: to fetch all other messages, not already handled by any of the definition according to the above description, create yet another Handler according to the following definition:
handler.others.type=textfile
handler.others.filename=<path to the debug file>
handler.others.filter=!ifs.fnd.log.TagFilter,<list of objects>
handler.others.includepackage=false
where <list of objects> is a comma separated list of objects
(queues, connectors) already handled by other Handlers.
Note the exclamation mark before the filter specification!
Example: Say your batchserver1-logging.properties has the following contents:
global.level=DEBUG

handler.alert.type=textfile
handler.alert.filename=C:/ifs/instance/prod/logs/batchserver/ifsalert.log
handler.alert.level=error

handler.connectlog.type=textfile
handler.connectlog.filename=C:/ifs/instance/prod/logs/batchserver/ifsconnect.log

handler.connectlog.level=info
handler.connectlog.categories=integration
handler.connectlog.includepackage=false

handler.agenda1.type=textfile
handler.agenda1.filename=C:/ifs/instance/prod/logs/batchserver/agenda1.log
handler.agenda1.filter=ifs.fnd.log.TagFilter,AGENDA1
handler.agenda1.includepackage=false

handler.in1.type=textfile
handler.in1.filename=C:/ifs/instance/prod/logs/batchserver/in1.log
handler.in1.filter=ifs.fnd.log.TagFilter,IN1
handler.in1.includepackage=false

handler.out1.type=textfile
handler.out1.filename=C:/ifs/instance/prod/logs/batchserver/out1.log
handler.out1.filter=ifs.fnd.log.TagFilter,OUT1
handler.out1.includepackage=false
So now, beside of the alert and log files, you will also get three additional
debug files for queues AGENDA1, IN1 and OUT1.
But if you now want to fetch all the others debug messages in a separate file you
can add the following definition:
handler.others.type=textfile
handler.others.filename=C:/ifs/instance/prod/logs/batchserver/others.log
handler.others.filter=!ifs.fnd.log.TagFilter,AGENDA1,IN1,OUT1
handler.others.includepackage=false
As mentioned, in some situations it can be necessary to deal with the
old, IFS Connect own, debugging framework. The sections below describe
how to set up debugging for
Batch and Connect
servers.
The situation with debugging from the Application Server is a bit different. Currently debug messages from the J2EE framework are not tagged. But on the other hand logic within the Application Server will execute continuously in one thread only.
So for better overview of debugging printouts you can use a handler definition that will split the output to separate files; one per thread:
handler.connectdebug.type=textfile
handler.connectdebug.filename=<path to the debug file>
handler.connectdebug.categories=integration,gateway
handler.connectdebug.perthread=true
Usually J2EE Servers reuse threads, so one file will most probably contain more than only messages coming from one, single request. But on the other hand the request debugging will be consistent and continuous without interruptions from other threads and requests.
The section below describes how to set up
debugging of Application
Server in situation when it can be necessary to deal with the old, IFS
Connect own, debugging framework.
As mentioned previously, in some situations it can be necessary to work, in conjunction to the described above common logging framework, also with the old, IFS Connect own, debugging framework. Activation and configuration of IFS Connect own debugging can be done in the Integration Configuration feature of IFS Solution Manager. On several IFS Connect objects it is possible to enable/disable debugging, define the debug level and define debug file:
DEBUG - Use to enable or disable debug information
generation.DEBUG_LEVEL - Controls amount of debug information.DEBUG_FILE - Specifies path to file to which the debug
information will be written.In general all
information send to IFS Connect own log files will also be collected by Loggers of
the common logging framework, so the files specified by the DEBUG_FILE
parameter can in most cases be ignored, but it can be necessary to set up log levels in
IFS
Connect anyway.
Following IFS Connect objects define debugging parameters DEBUG,
DEBUG_LEVEL and DEBUG_FILE:
IFS Connect uses object (configuration parameter instance) names, i.e. names of readers, senders, queues, agendas and servers, as Tags, which can be used in conjunction with TagFilter to filter logging output relevant for a particular instance. The most of code is already using the new logging framework, so dealing with the old fashion debug parameters should be chosen as a last choice.
To debug Batch Server you have to enable debugging on at least one of message
queues:

By default Batch Server creates its log files, one per message queue, in directory
<ifs_home>\instance\<instance_name>\logs\batchserver.
To debug Connect Server you have to enable debugging on at least one of
connect readers or MQSeries sender:

By default Connect Server creates its log files, one per reader, in directory
<ifs_home>\instance\<instance_name>\logs\connectserver.
To debug the Application Server you have to enable debugging on J2EE_SERVER
instance:

By default Application Server creates its log files, one per request, in directory
<ifs_home>\instance\<instance_name>\logs\j2ee.
To enable debugging for messages initiated from the Batch Server the
J2EE_SERVER debug parameter above must be set as well as the actual queue's debug
parameter as described above.
These filenames will start with the queue instance name, for example: BATCH1-3933.0-d0d909a0-64d4-11da-2c97-be44525c818c.log
To enable debugging for messages initiated from the Connect Server the
J2EE_SERVER debug parameter above must be set as well as the actual reader's debug
parameter as described above.
These filenames will start with the reader instance name, for example: FILE_READER1-dc1e1970-64d6-11da-2c97-be44525c818c.log