Example Report with a matrix, pie chart and parameters
In this example, you will analyze cost balances categorized based on cost centers
and account groups using a matrix and a pie chart. Parameters will be used to filter
data for company, business unit, year and period.
Contents
- Go through Getting Started section
- Open Business Intelligence/My Reports page
in IFS Enterprise Explorer and click Report Builder
to start the reporting tool.
- Create a new, blank report using the New Report
or Dataset dialog box.
- Create a data source and a dataset as described in
Data sources and Datasets section
and set up the GL_Balance_Dataset as mentioned there.
- Select the dataset, right click and then click
Query to open the Query Designer dialog
box.
- Drag and drop Company from the Company dimension to the upper-right
pane of Query Designer dialog where filters and
parameters are defined.
- Select Equal for the
Operator field, and 900 for the
Filter expression field (default value when
used as a parameter). Select Parameter checkbox.
Note: You might already have Company as a filter/parameter,
if you entered that when initially creating the dataset.
- Similarly define the following as parameters too:
Accounting Year: 2006 as default value,
Accounting Period: 1, 2, 3 as default
values.
- The filter and parameters defined in the dataset query designer will look
like the screen below:
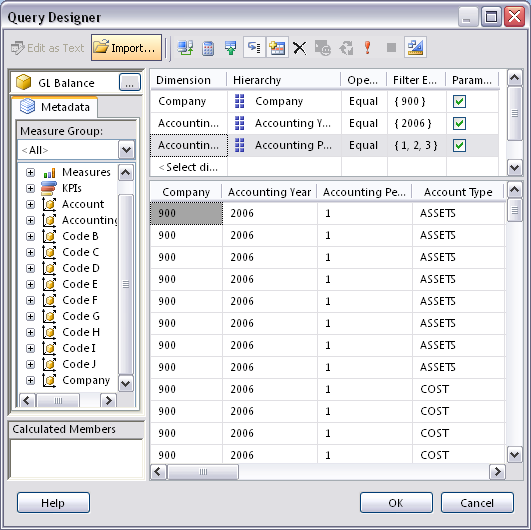
Figure 1: Parameters added to the dataset in Query Designer
window
- The dataset parameters entered above become report parameters and they can
be viewed under Parameters in the
Report Data pane (see below) in design
view.
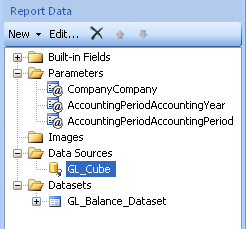
Figure 2: Parameters viewed from Report Data pane
- Select Parameters folder in the
Report Data pane, right-click and then click
Add Parameter.
- Under General Properties in the
Report Parameter Properties dialog box, enter
values for the Name and
Prompt (BUS_UNIT, Business Unit:);
Select Text for the Data Type field and Visible for the
Select Parameter Visibility field.
- Select the Get values from a query option in the Available Values
section. Select GL_Balance_Dataset for Dataset, Code_D
(for Business Unit) for the Value field, and Code_D_Description
for the Label field.
- Select the Specify Values option in the Default Values section;
click Add and enter RAE (for Racing Engine business unit). Click
Ok.
Note that BUS_UNIT report parameter is also added to the
Parameters
folder in Report Data pane.
Note: Use of dataset parameters and
filters is preferred over use of report parameters and filters because dataset parameters
and filters result in better performance in the reports
Click
here for
more details on TechNet about parameters.
Click
here for
a detailed tutorial about parameters on TechNet.
- Click Matrix in the
Data Regions section of the
Insert
tab of the ribbon. Then click Matrix Wizard.
- Select the GL_Balance_Dataset in the Choose
a dataset page and click Next.
- Select BALANCE from the Available Fields
field in the Arrange Fields page and drag and drop it to the
Values field.
Drag and drop Code_B (for cost center) to the
Row Groups field,
and Code_D (for business unit) to the Column Groups field. Click
Next.
- In Choose the layout page select
Show subtotals and grand totals option and
click Next.
- Select Generic in
Choose a style page and click
Finish.The matrix is added to the design area.
Click here
for a detailed tutorial on TechNet about creating a matrix report.
- Change first column header to Cost Center.
- Select the second column and right-click and then click
Insert Column/Inside
Group - Right to insert a new column in the Code_D column group.
- Merge second and third column header cells and enter Business Unit: [Code_D_Description]
as the column header. Code_D_Description has to be dragged from the
dataset and dropped into the column header.
- Select Indicator from
Data Visualizations section of the
Inserttab and click on the second cell of the third column to
insert an indicator. Select 3 Flags indicator type under
Symbols
category.
- For indicator values, select BALANCE.
- Select the indicator, right click and then click
Indicator properties.
SetupValues and Statesin
Indicator Properties dialog
box as displayed below:
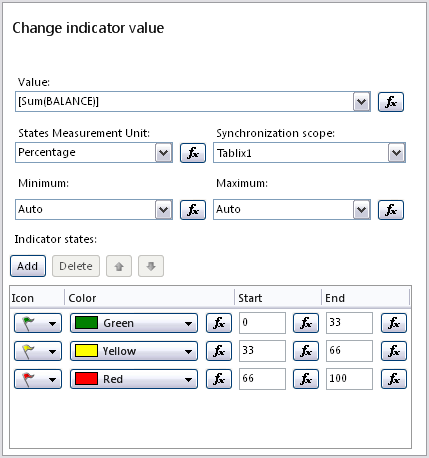
Figure 3: Values and States of Indicator in the Matrix
- Select the matrix you previously entered.
- Find Filters property for matrix in the
Properties pane and go to details
to change filters.
- Click Add. Select Code_D for the
Expression field and =
for Operator field.
- To enter a value for Values field, click fx
to go to Expression dialog. Select Parameters
in the Category section in the Expressions dialog box and double
click BUS_UNIT to add an expression for the parameter value in Set expression for:
field and click OK. Use the screen below for reference:
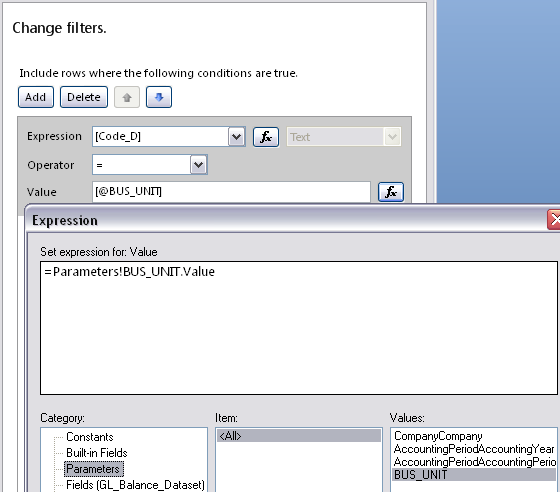
Figure 4: Adding parameter value for the expression of a filter.
- Add Account Type = COST as a filter to restrict balances to cost account
balances.
Note: The Company, Year and Period dataset parameters
need not be added to the report as filters since they are applied to the dataset
and hence will be effective in a report that uses the dataset.
-
Click Chart in the
Data Visualizations section of the
Insert
tab and then click Insert Chart.
-
Click and drag the chart in the design area to position and resize it as
required.
-
In the Select Chart Type dialog that opens,
select a pie chart type (e.g. Exploded pie in
the Shape category) and click
OK.
-
Click on the chart and select the dataset in DataSetName property
in the Properties pane.
-
Click again on the chart to open the Chart Data pane. Using
+ mark on Values section add BALANCE. Select Account Group
for the Category Groups section.
- Select Category Group Properties for the Account_Group category
group. Select Account_Group_Description for the Label field in
the General section and click
OK.
-
Click on chart title and enter Cost Breakdown.
Click here
for a detailed tutorial on TechNet about adding a pie chart.
- Add filters to the chart, by selecting chart and going to
Filter property. Enter filters for
Code_D and Account_Type
as displayed below.
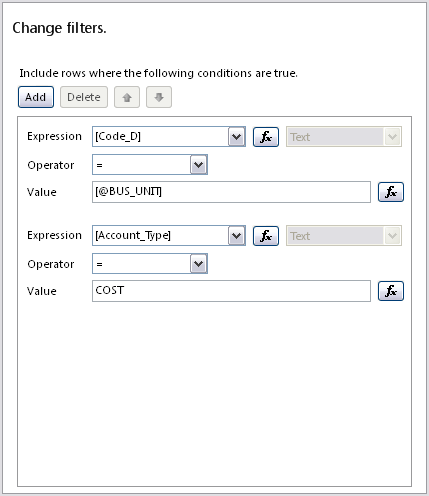
Figure 5: Filters added to the pie chart
- To change color scheme of the chart, select the chart, go to
Palette property in the
Properties pane. Select a preferred color
palette, for e.g. Pastel.
- Use properties BackgroundColor,
BackgroundGradientEndColor, and
BackgroundGradientType in the
Properties pane to change the background colour.
- To add tooltip for chart, select the pie of the chart and go to
ToolTip property. For expression enter
=Sum(Fields!BALANCE.Value).
- Enter Cost Breakdown as the title of the chart. Use font Verdana and
font size 12.
- Enter Cost Analysis as the title of the report. Use font Verdana and font
size 14.
- Save the report in required folder for e.g. My
Reports folder in the report server
- Run the report by clicking Run in
Home tab.
- The report will be displayed with default parameter values. Change the parameter
values as required and click View Report to
view a report for different parameters.
The resultant report is displayed below.
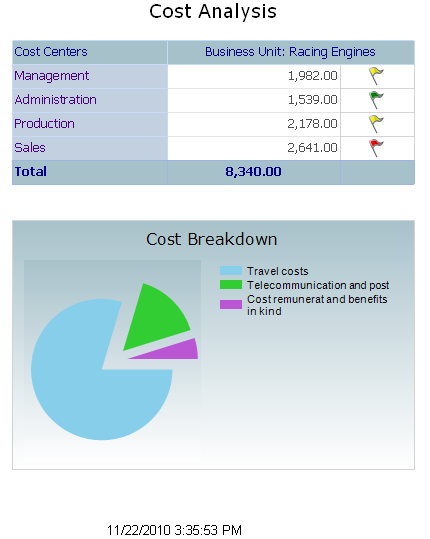
Figure 6: Resultant report